Water Level & Hydrology
Locate gauges, center the PTZ camera and recognize graduations and the waterline to record level changes. Surface velocity can be added where conditions permit.

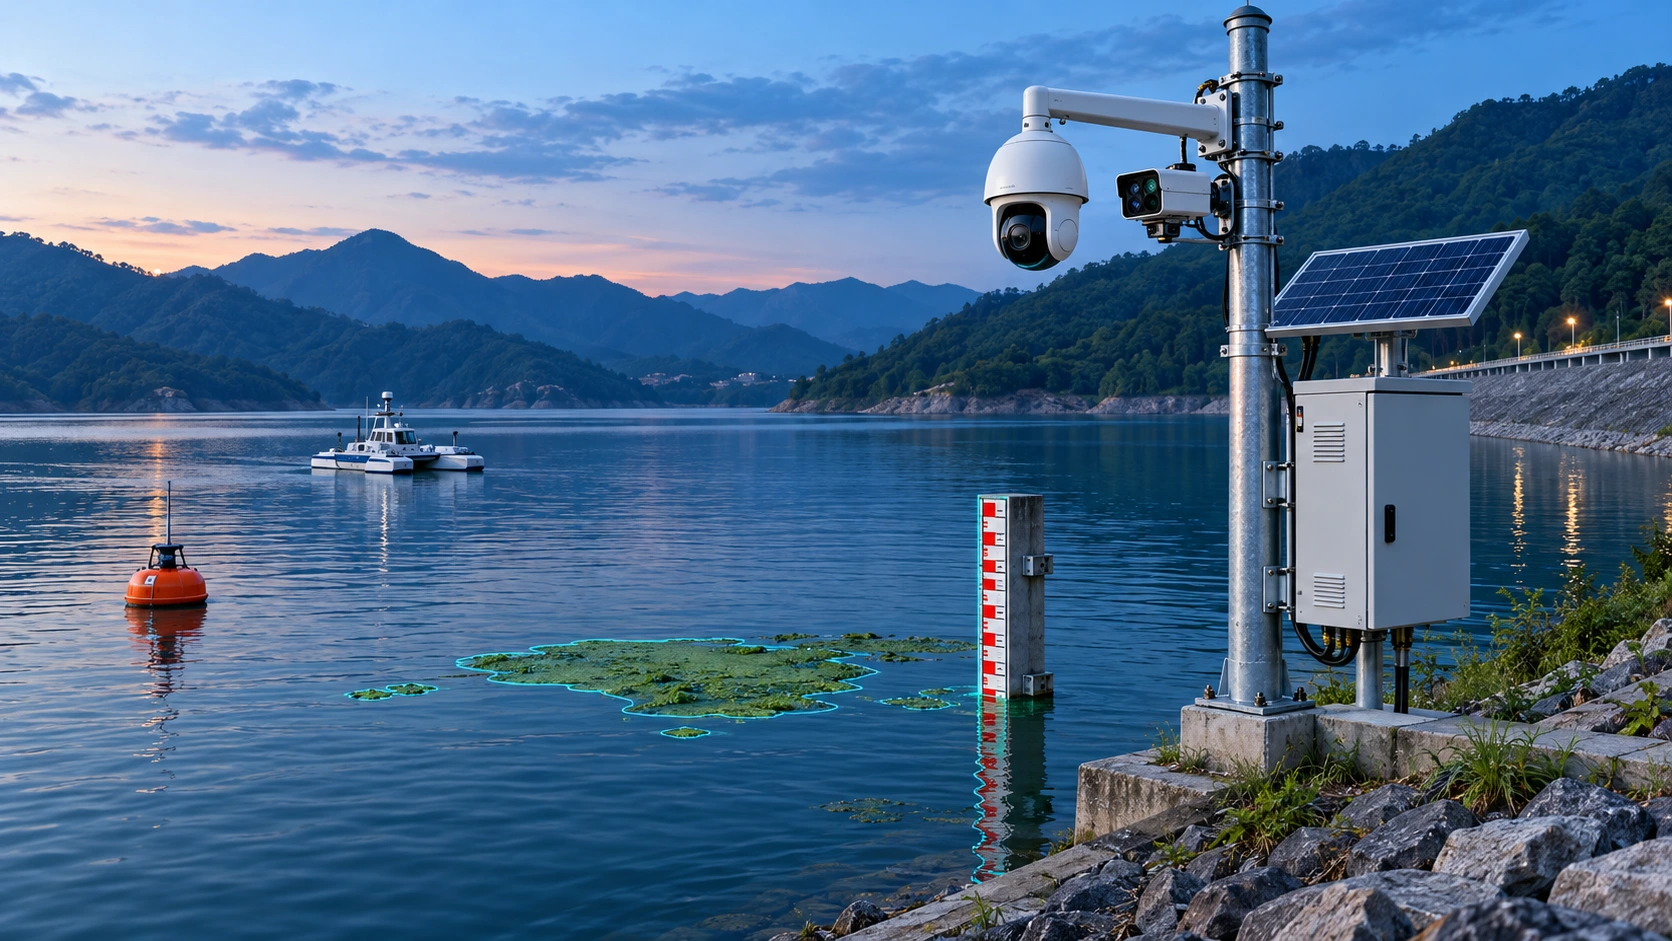
INTEGRATED WATER MONITORING
Integrate gauge recognition, spectral bloom detection, black-odorous water assessment and section monitoring on a shared timeline of spectral results, video events and hydrological changes.
01 / INTEGRATED SENSING
Locate gauges, center the PTZ camera and recognize graduations and the waterline to record level changes. Surface velocity can be added where conditions permit.
Acquire water spectra and use models to assess chlorophyll-a, turbidity, suspended solids and bloom risk while tracking changes at the section.
Combine water-condition models with detection of unusual discharge, debris, oil and foam; use video and sampling for verification.
Bloom and black-odorous water detection provides assessment indicators to be reviewed with site conditions, spectral models, reference testing and manual checks.
02 / ONE SECTION, ONE TIMELINE
Acquire corresponding spectra, images or sensor signals at the site and record acquisition conditions.
Align information by time, location and device identifier for cross-source comparison.
Use trends and event rules to flag changes and link original data for review.
Combine sampling, reference tests and repeat field measurements; record findings and follow-up actions.
Fixed cameras and spectral equipment provide continuous observation, with drones or unmanned vessels extending coverage and supporting sampling of suspected bloom areas.
Combine water color, spectral models, unusual discharge and field records to identify trends and support outfall and pipe-network investigations.
Fixed stations or buoys sample periodically while water-level observations help explain relationships between spectral changes and hydrological conditions.
Retain timestamps, water levels, model outputs, images, video clips and verification findings as traceable event records.
03 / EQUIPMENT COMBINATION
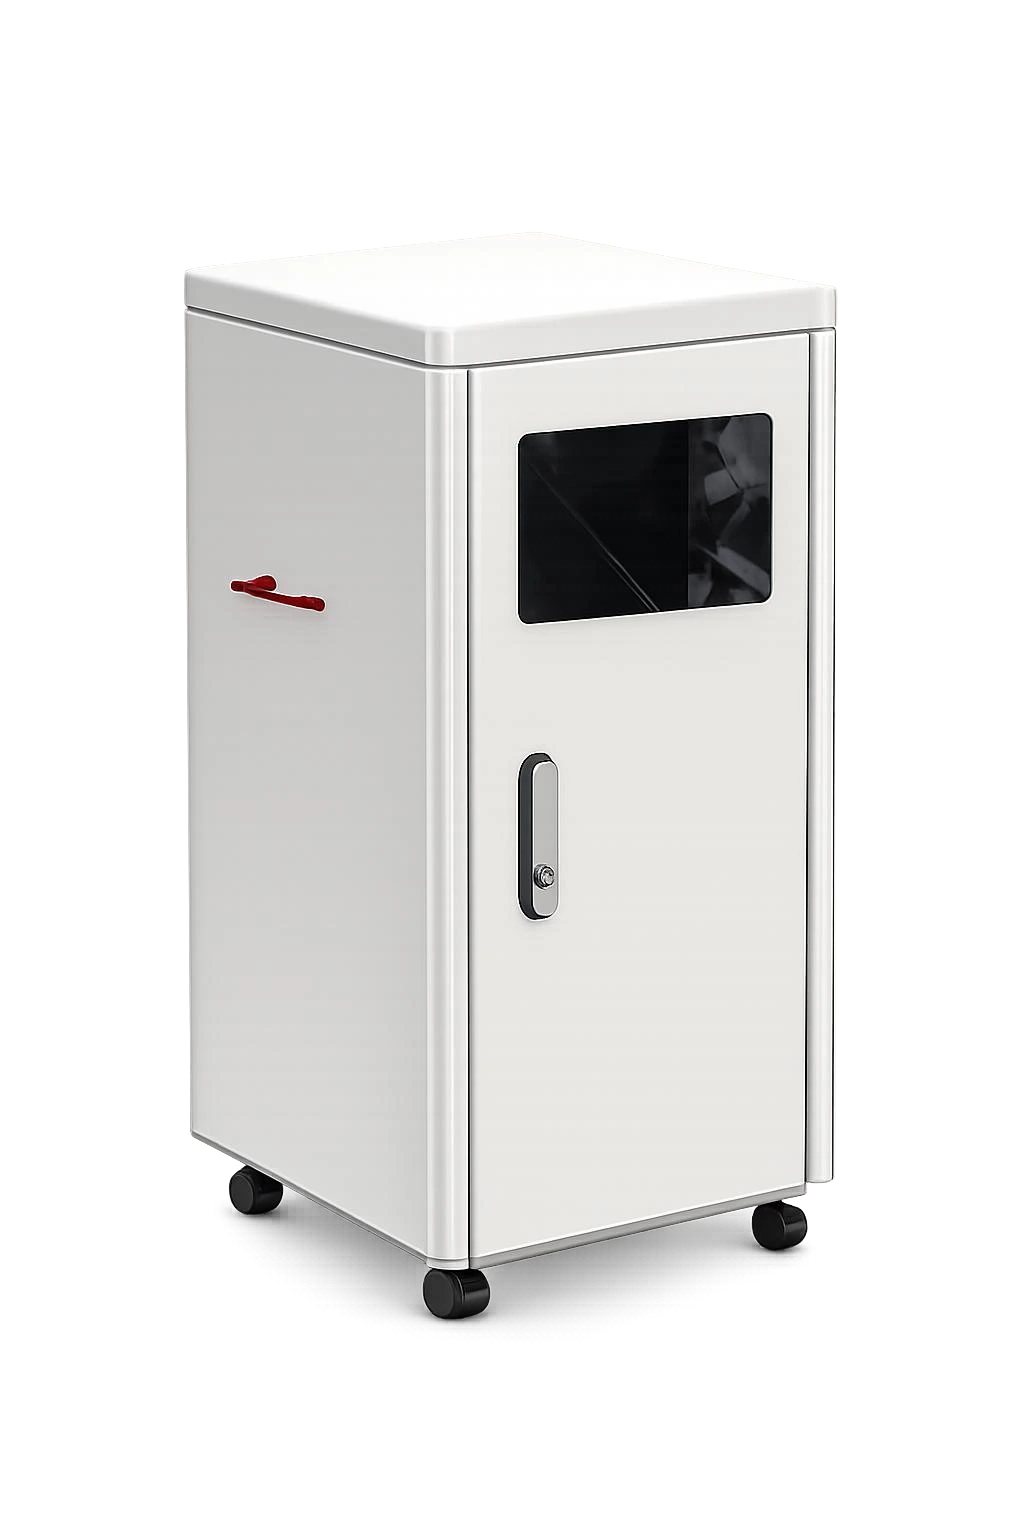
Continuous monitoring of river and lake sections, outfalls and water sources, integrating water sampling, spectral analysis and model inversion.
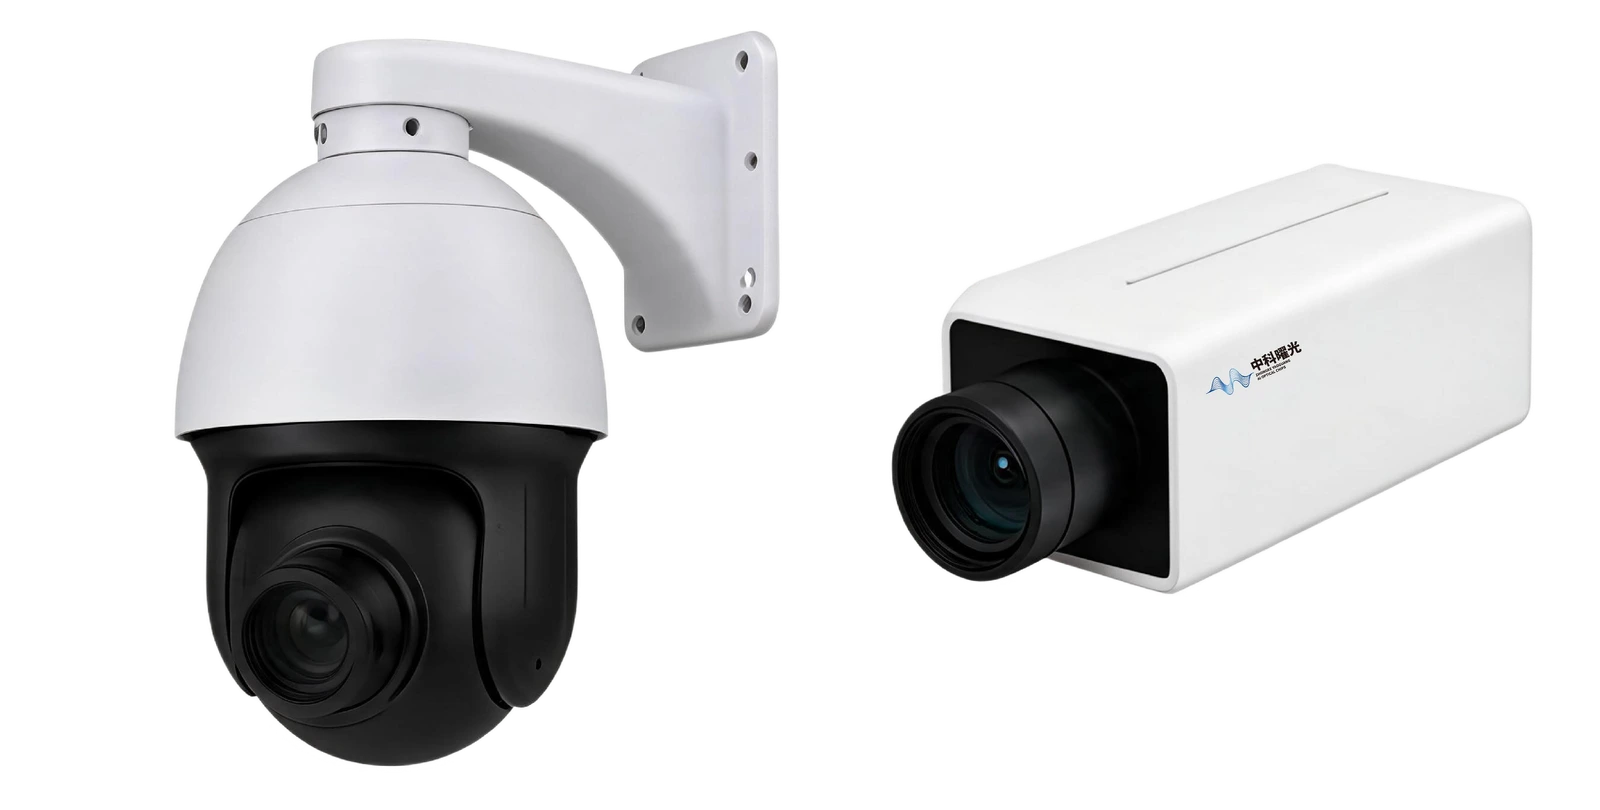
Associate water spectra, visible video and field events with edge computing and water-quality models.
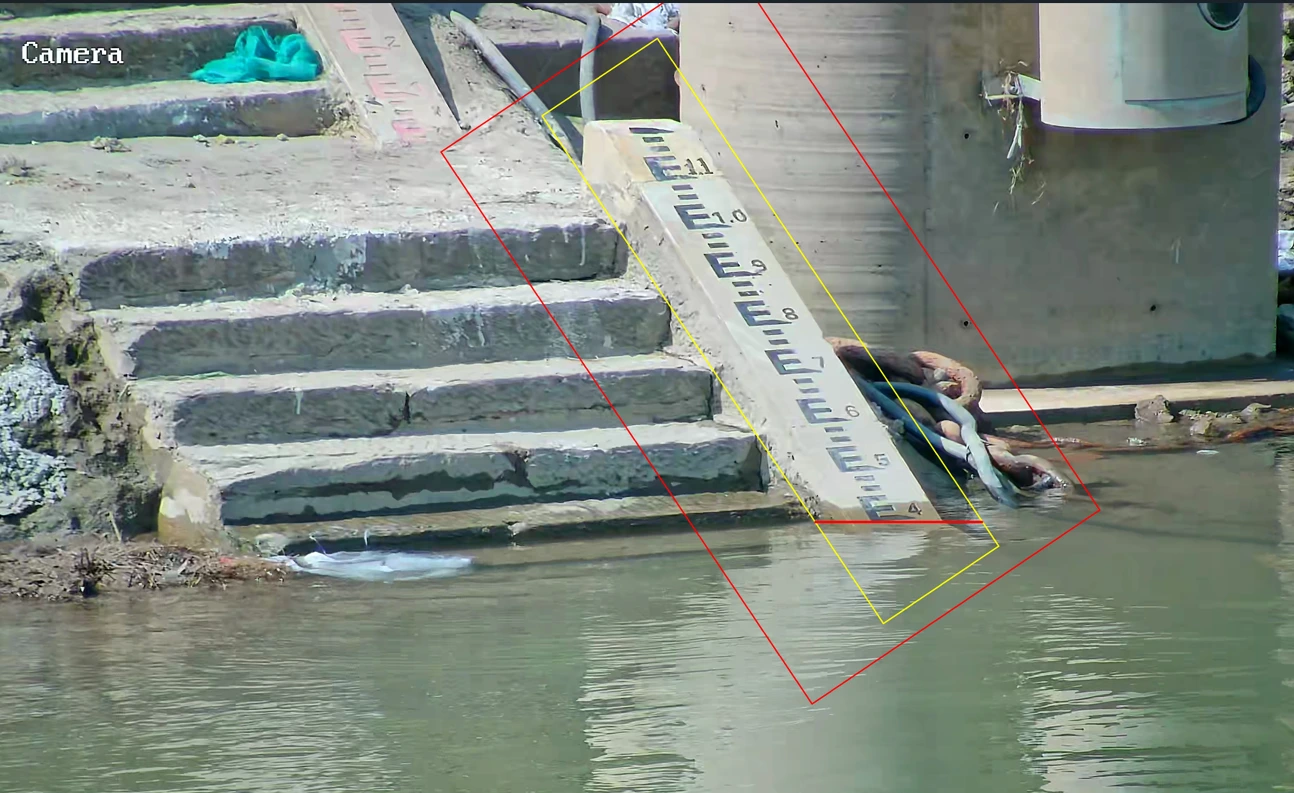
Camera and RK3588 edge computing support full-frame gauge detection, PTZ control, water-level measurement and surface-velocity recognition.
Add buoys where shore installations are limited, drones or unmanned vessels for wider coverage, and pipe-network devices for source investigation.
04 / AI WATER LEVEL
Full-frame gauge detection → PTZ centering and staged zoom → Waterline and graduation recognition → Level, confidence and verification image. Supports RK3588 edge computing, scheduled acquisition and retries.
Test conditions: Cuntan field comparison, July 14–21, 2026; mean acquisition interval 30.3 minutes.
SOLUTION / TARGETS
Locate gauges, center PTZ and adjust zoom; output level, confidence and verification images.
Track blooms, water appearance and section models alongside level changes.
Link floating debris, unusual discharge and video to verification and response.
SOLUTION / CONFIGURATION
| Monitoring task | System configuration | Outputs |
|---|---|---|
| Gauge vision | Camera + PTZ + RK3588 edge unit | Water level, confidence and recognition images |
| Spectral monitoring | YGGP-3 / YGGP-CM3 | Section spectra, blooms and water models |
| Mobile measurements | Portable instrument + UAV / unmanned boat | Additional measurements and sampling |
| Unified platform | Site records + event timeline | Levels, images, model results and work orders |
Configure sensing and integration components for the selected site and monitoring task.
SOLUTION / DELIVERY
Confirm gauge datum, view angle, distance, obstruction, power and communications.
Configure search, PTZ and graduation recognition against reference levels.
Unify timestamps, sites and device identifiers across level, spectra and video.
Schedule capture, retry low-confidence readings and retain verification records.
SOLUTION / EVALUATION
381 valid comparisons at Cuntan; mean absolute error 1.47 cm.
RMSE 1.68 cm; maximum absolute error 2.90 cm.
14–21 July 2026; mean capture interval 30.3 minutes.
Gauge photos and datum, installation distance, reference levels, power/network access and spectral targets.
BD@zhongkeyaoguang.com ↗CONTACT
Contact us for product selection, development
and project collaboration.
266 Fangzheng Avenue, High-tech Park, Liangjiang New Area, Chongqing, China
Zhongke Yaoguang (Chongqing) Optoelectronics Technology Co., Ltd.