River & Lake Sections and Drinking-Water Sources
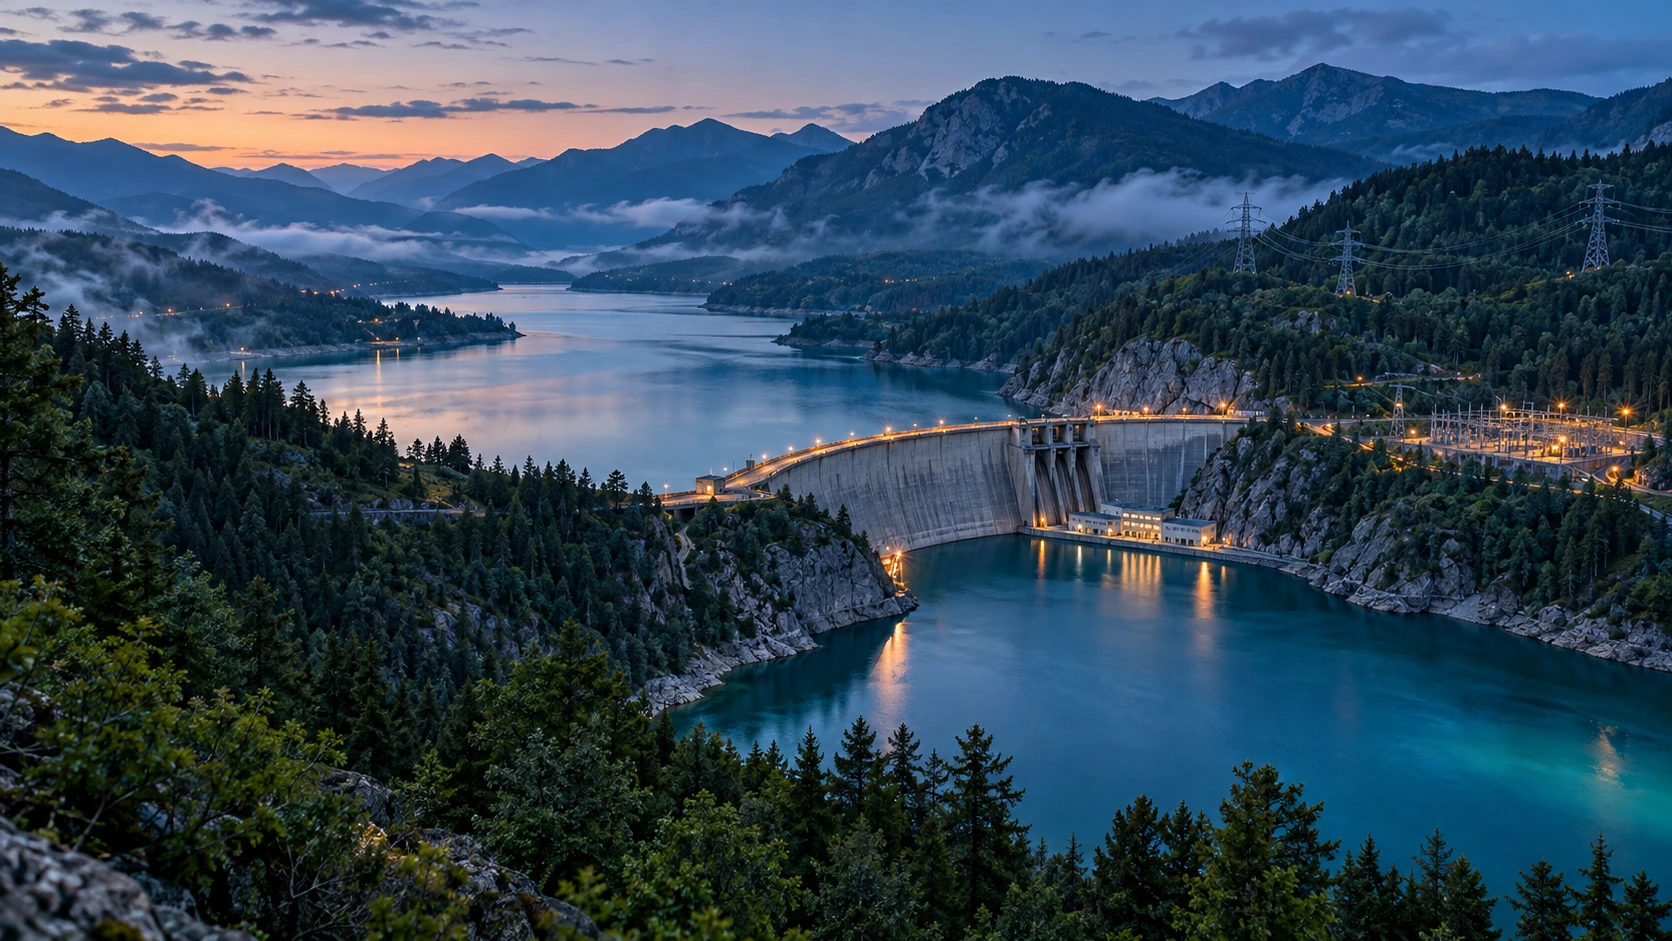
Fixed stations and buoys collect spectra and model results. Video detection of blooms, debris and unusual discharge supports targeted sampling.

ENVIRONMENTAL MONITORING
Combine spectra, site video and spatial location to detect changes, locate events and organize verification.
01 / APPLICATION MATRIX
Fixed stations and buoys collect spectra and model results. Video detection of blooms, debris and unusual discharge supports targeted sampling.
Pipe-network spectrometers track water changes while robots capture internal imagery and structural information, linking findings by access point, outfall and time.
Airborne gas and particulate sensors combine tracks and concentration maps to identify anomalous areas. Ground measurements support verification before identifying a pollution source.
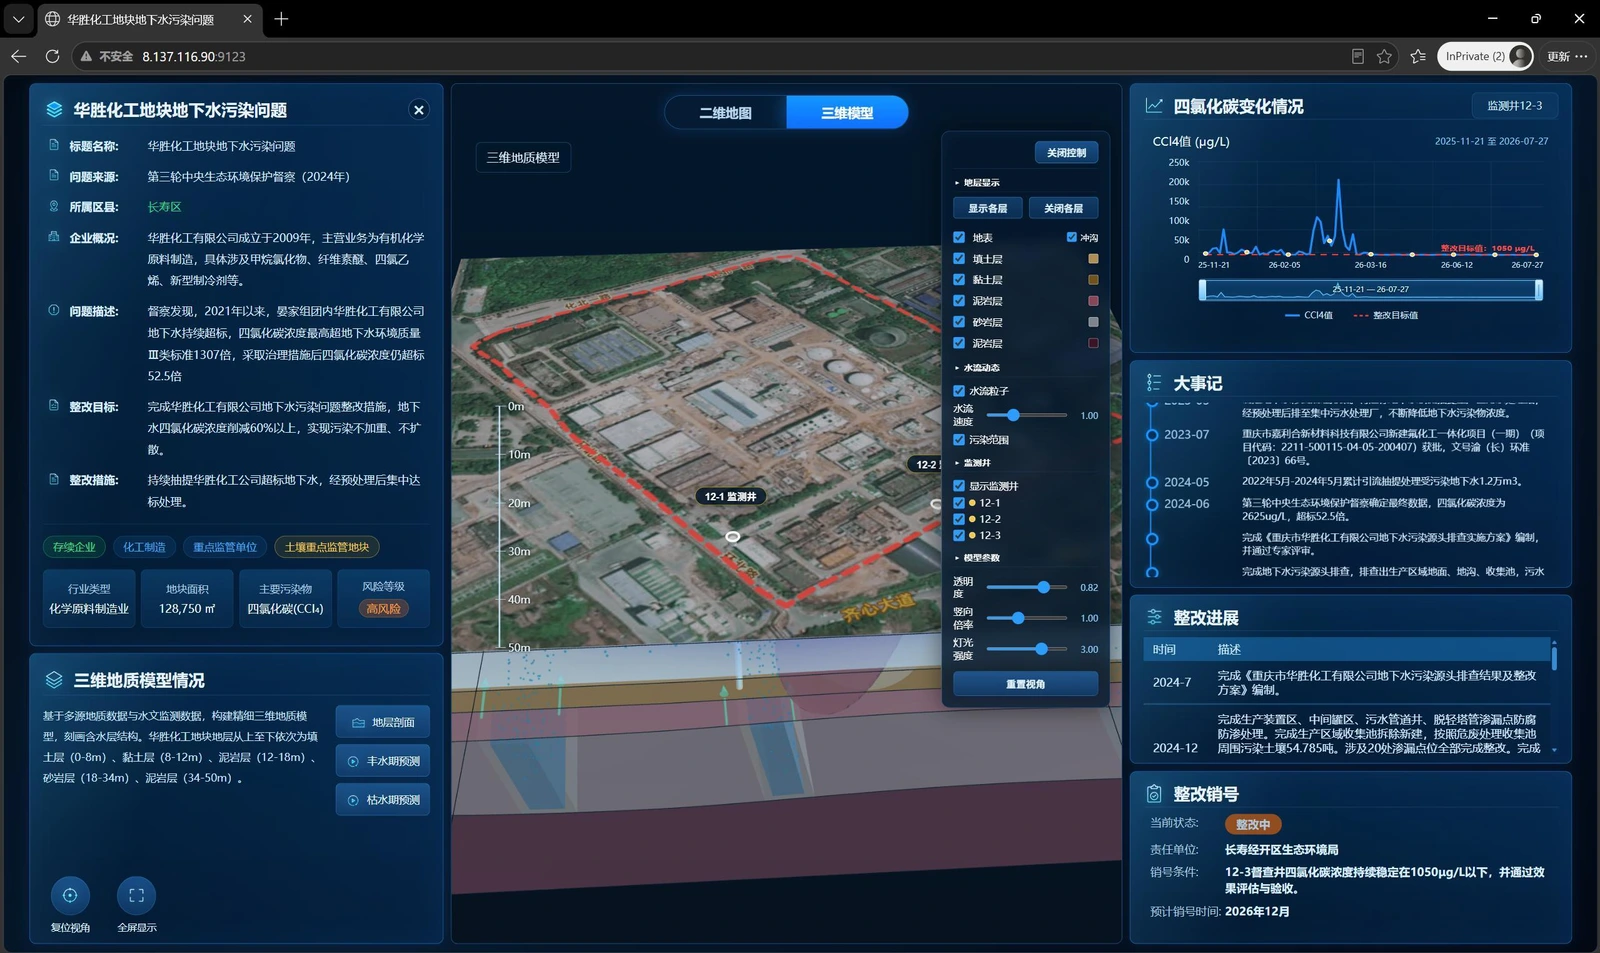
Combine monitoring-well data, stratigraphy and groundwater transport models to track contaminant plumes, trends and remediation records.
Combine unmanned-vessel surveys, sampling and controlled dosing; track changes and assess treatment outcomes using monitoring data.
02 / MEASUREMENT WORKFLOW
Acquire corresponding spectra, images or sensor signals at the site and record acquisition conditions.
Align video regions with pixel spectra and extract spatial, spectral and temporal features to associate water changes with site imagery.
Use trends and event rules to flag changes and link original data for review.
Combine sampling, reference tests and repeat field measurements; record findings and follow-up actions.
COD, ammonia nitrogen, total nitrogen and total phosphorus estimates rely on project samples and model inversion. Water type, season, illumination and background can affect performance; field calibration and ongoing verification are required.
SOLUTION / TARGETS
Combine water spectra, visible imagery and time series to locate bloom-related changes.
Link section models, water levels and sampling records to track treatment outcomes.
Use fixed-station anomalies to trigger sampling and pipe inspection.
SOLUTION / CONFIGURATION
| Monitoring task | System configuration | Outputs |
|---|---|---|
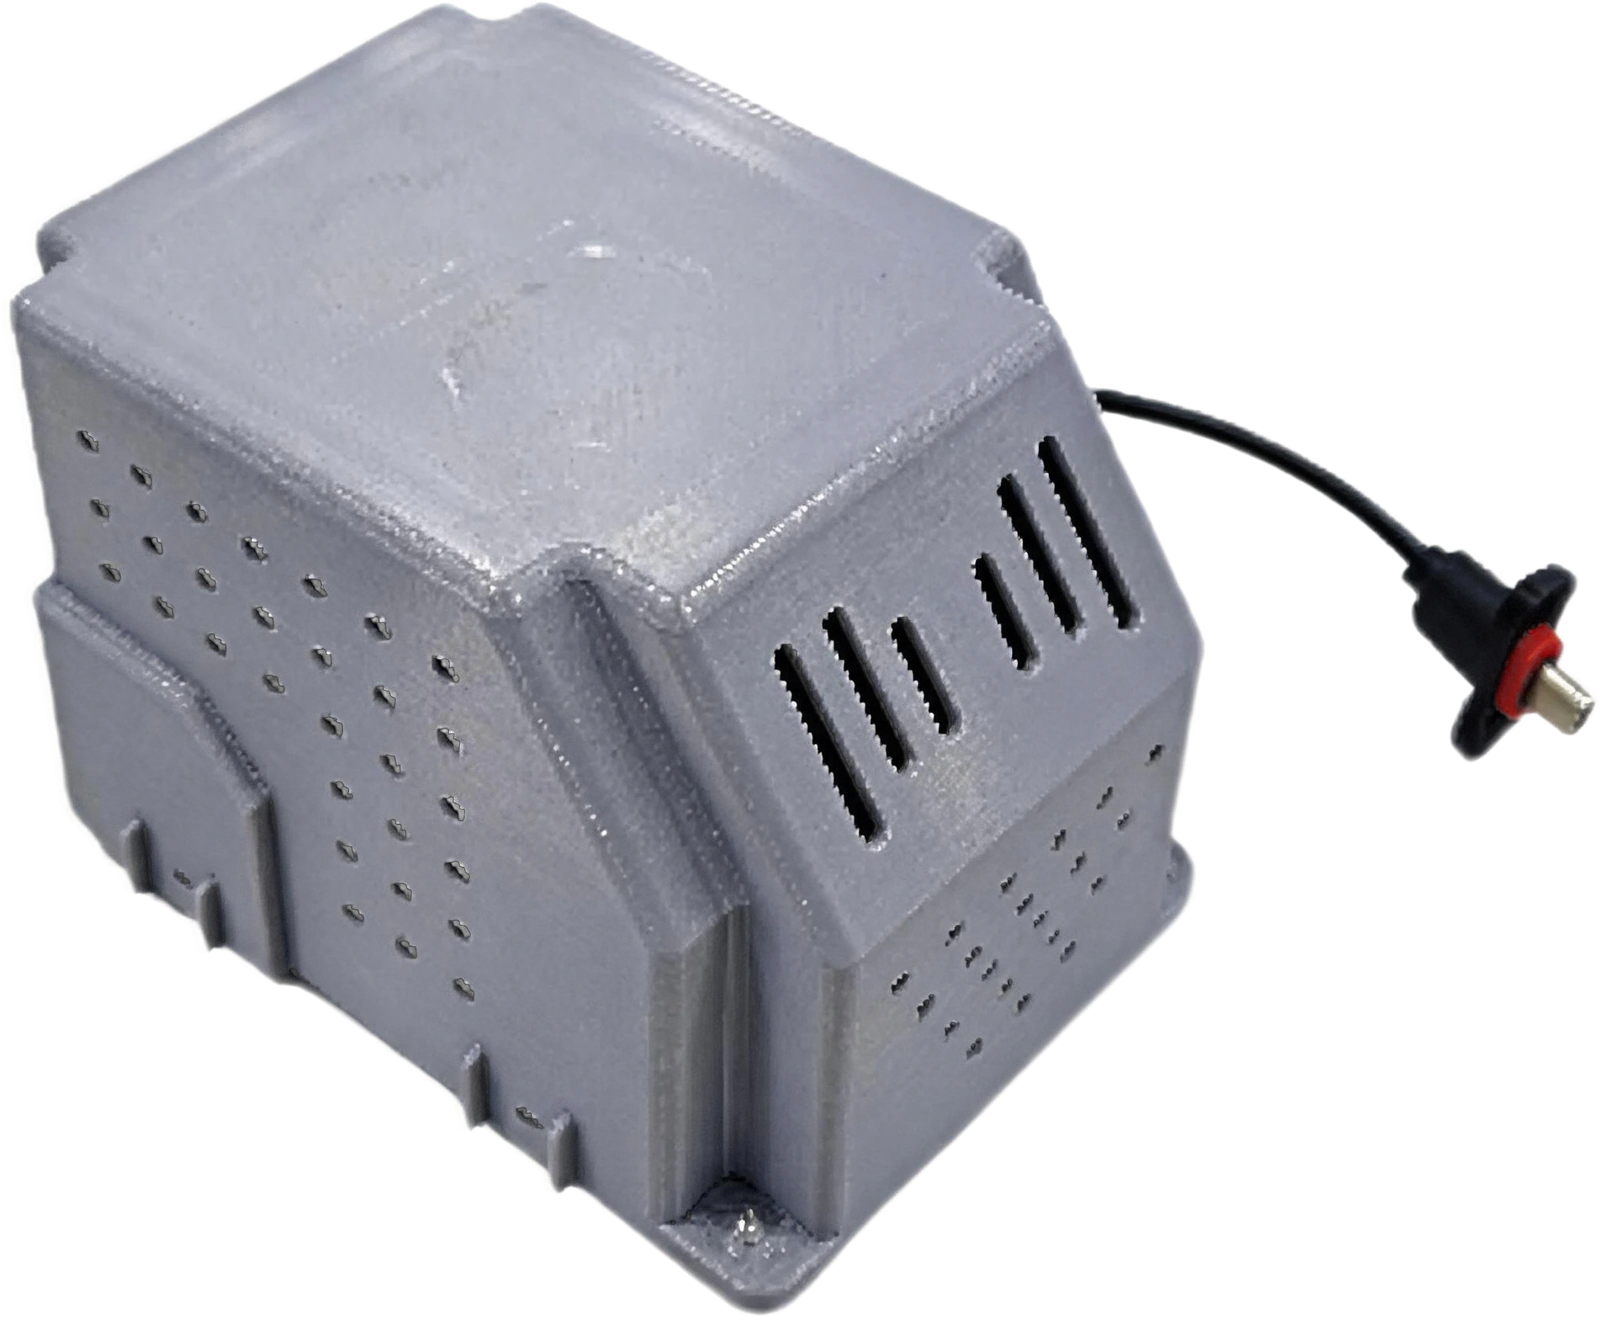
| Continuous sections | YGGP-3 fixed spectral analyzer | Periodic spectra, water models and change alerts |
| Area inspection | YGGP-CM3 + UAV spectral payload | Water imagery and anomaly distribution |
| Field retesting | YGGP-Min2 / Min3 portable instruments | Site measurements, sample spectra and records |
| Tracing extensions | YGGP-Min1 pipe instrument + inspection robot | Pipe changes, imagery and investigation leads |
Configure sensing and integration components for the selected site and monitoring task.
SOLUTION / DELIVERY
Define water body, season, target indicators and reference methods.
Acquire spectra, video, site conditions and samples at matched times and locations.
Hold out dates or sites to evaluate target-specific model performance.
Link imagery, sample results and response records to follow changes.
SOLUTION / EVALUATION
Report bias and MAE/RMSE for estimation; confusion matrices for classification.
Cover illumination, seasons, water backgrounds and concentration ranges.
Section trends, abnormal areas, sampling tasks and treatment comparisons.
Monitoring sections, target indicators, historical sample results, installation conditions and sampling plan.
BD@zhongkeyaoguang.com ↗CONTACT
Contact us for product selection, development
and project collaboration.
266 Fangzheng Avenue, High-tech Park, Liangjiang New Area, Chongqing, China
Zhongke Yaoguang (Chongqing) Optoelectronics Technology Co., Ltd.